duplicacy-exporter




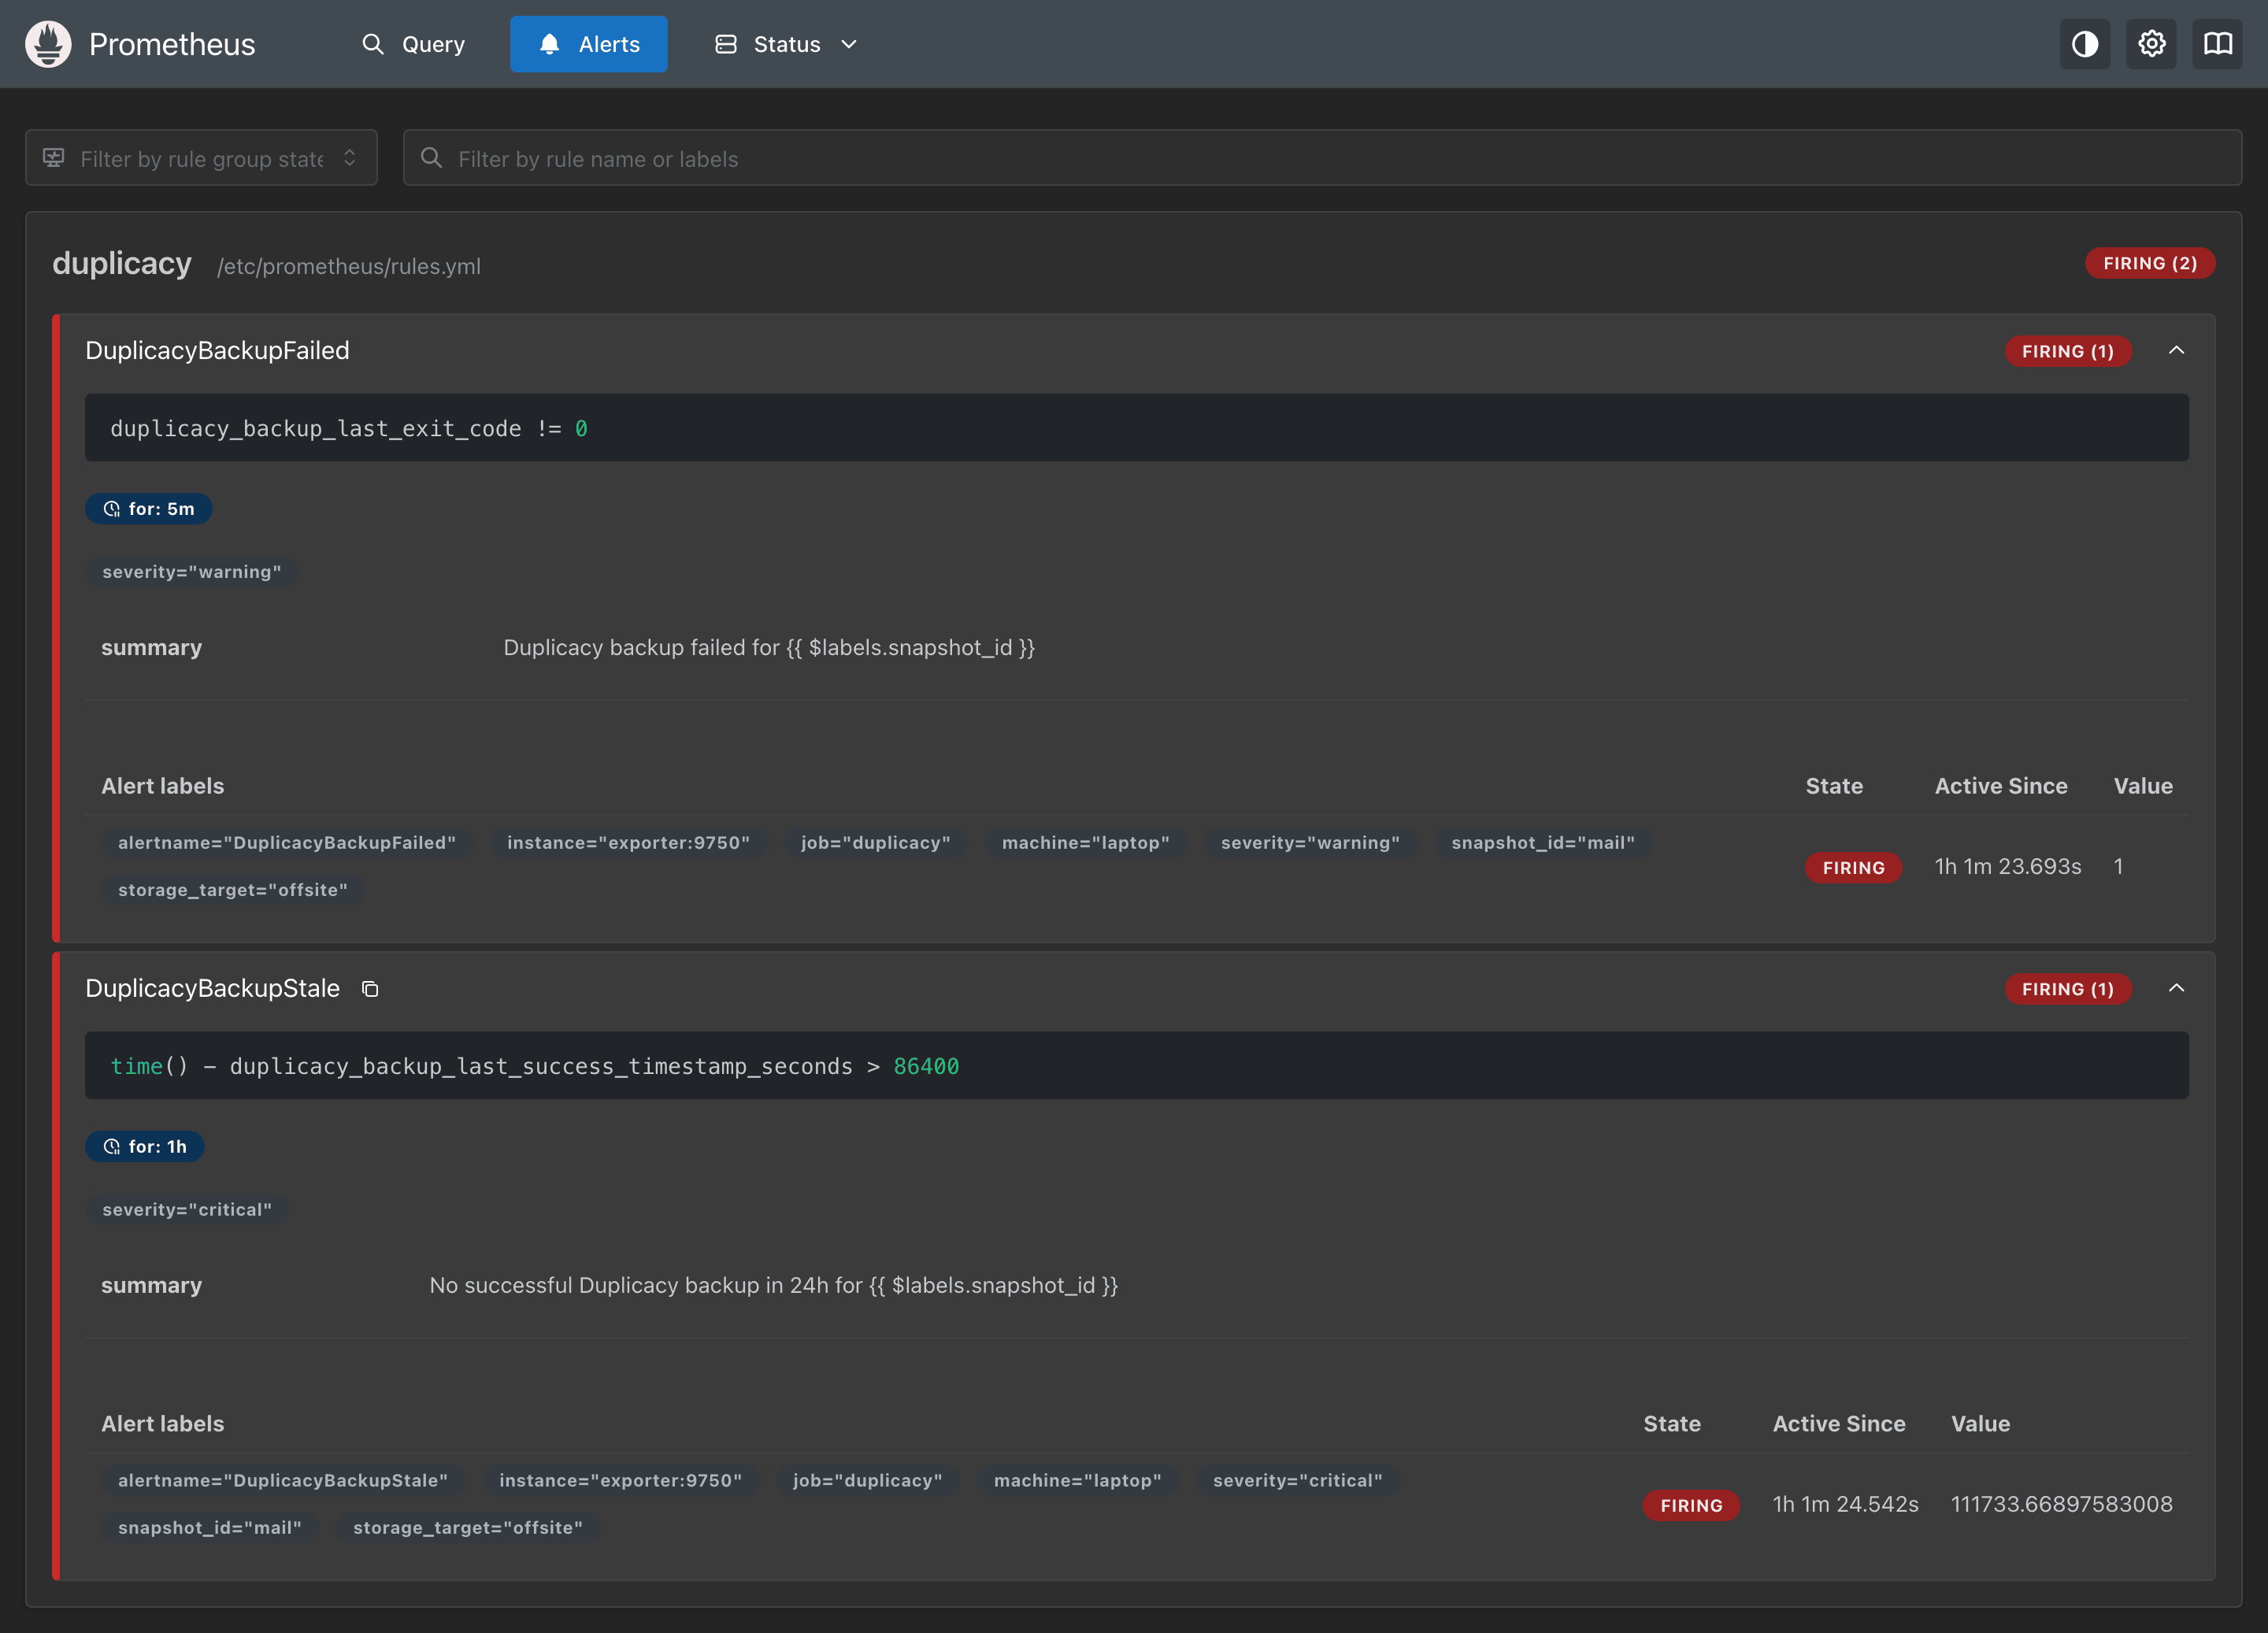
duplicacy-exporter turns Duplicacy backups into Prometheus metrics. It reads the CLI's log or receives the Web UI's report, and exposes progress and speed while a backup runs and the summary when it ends: duration, files, bytes uploaded, exit code and revision, per snapshot, storage and machine. Duplicacy on its own writes logs and sends email; nothing tells you that a backup failed last night or has not run for three days. With the exporter, Prometheus alerts on both, and the shipped Grafana dashboard shows every backup on every machine in one place. Start with Getting started, then Prometheus and Grafana.
-
One compose file for the CLI (log tail) or the Web UI (webhook), or
pipx install duplicacy-exporter. -
/healthsaysOK,/metricsnames the mode and version, and the first backup fills the series. -
The scrape job, two alert rules for a failed or stale backup, and the dashboard to import.
-
Every series, its type, its labels and where its value comes from.
The dashboard
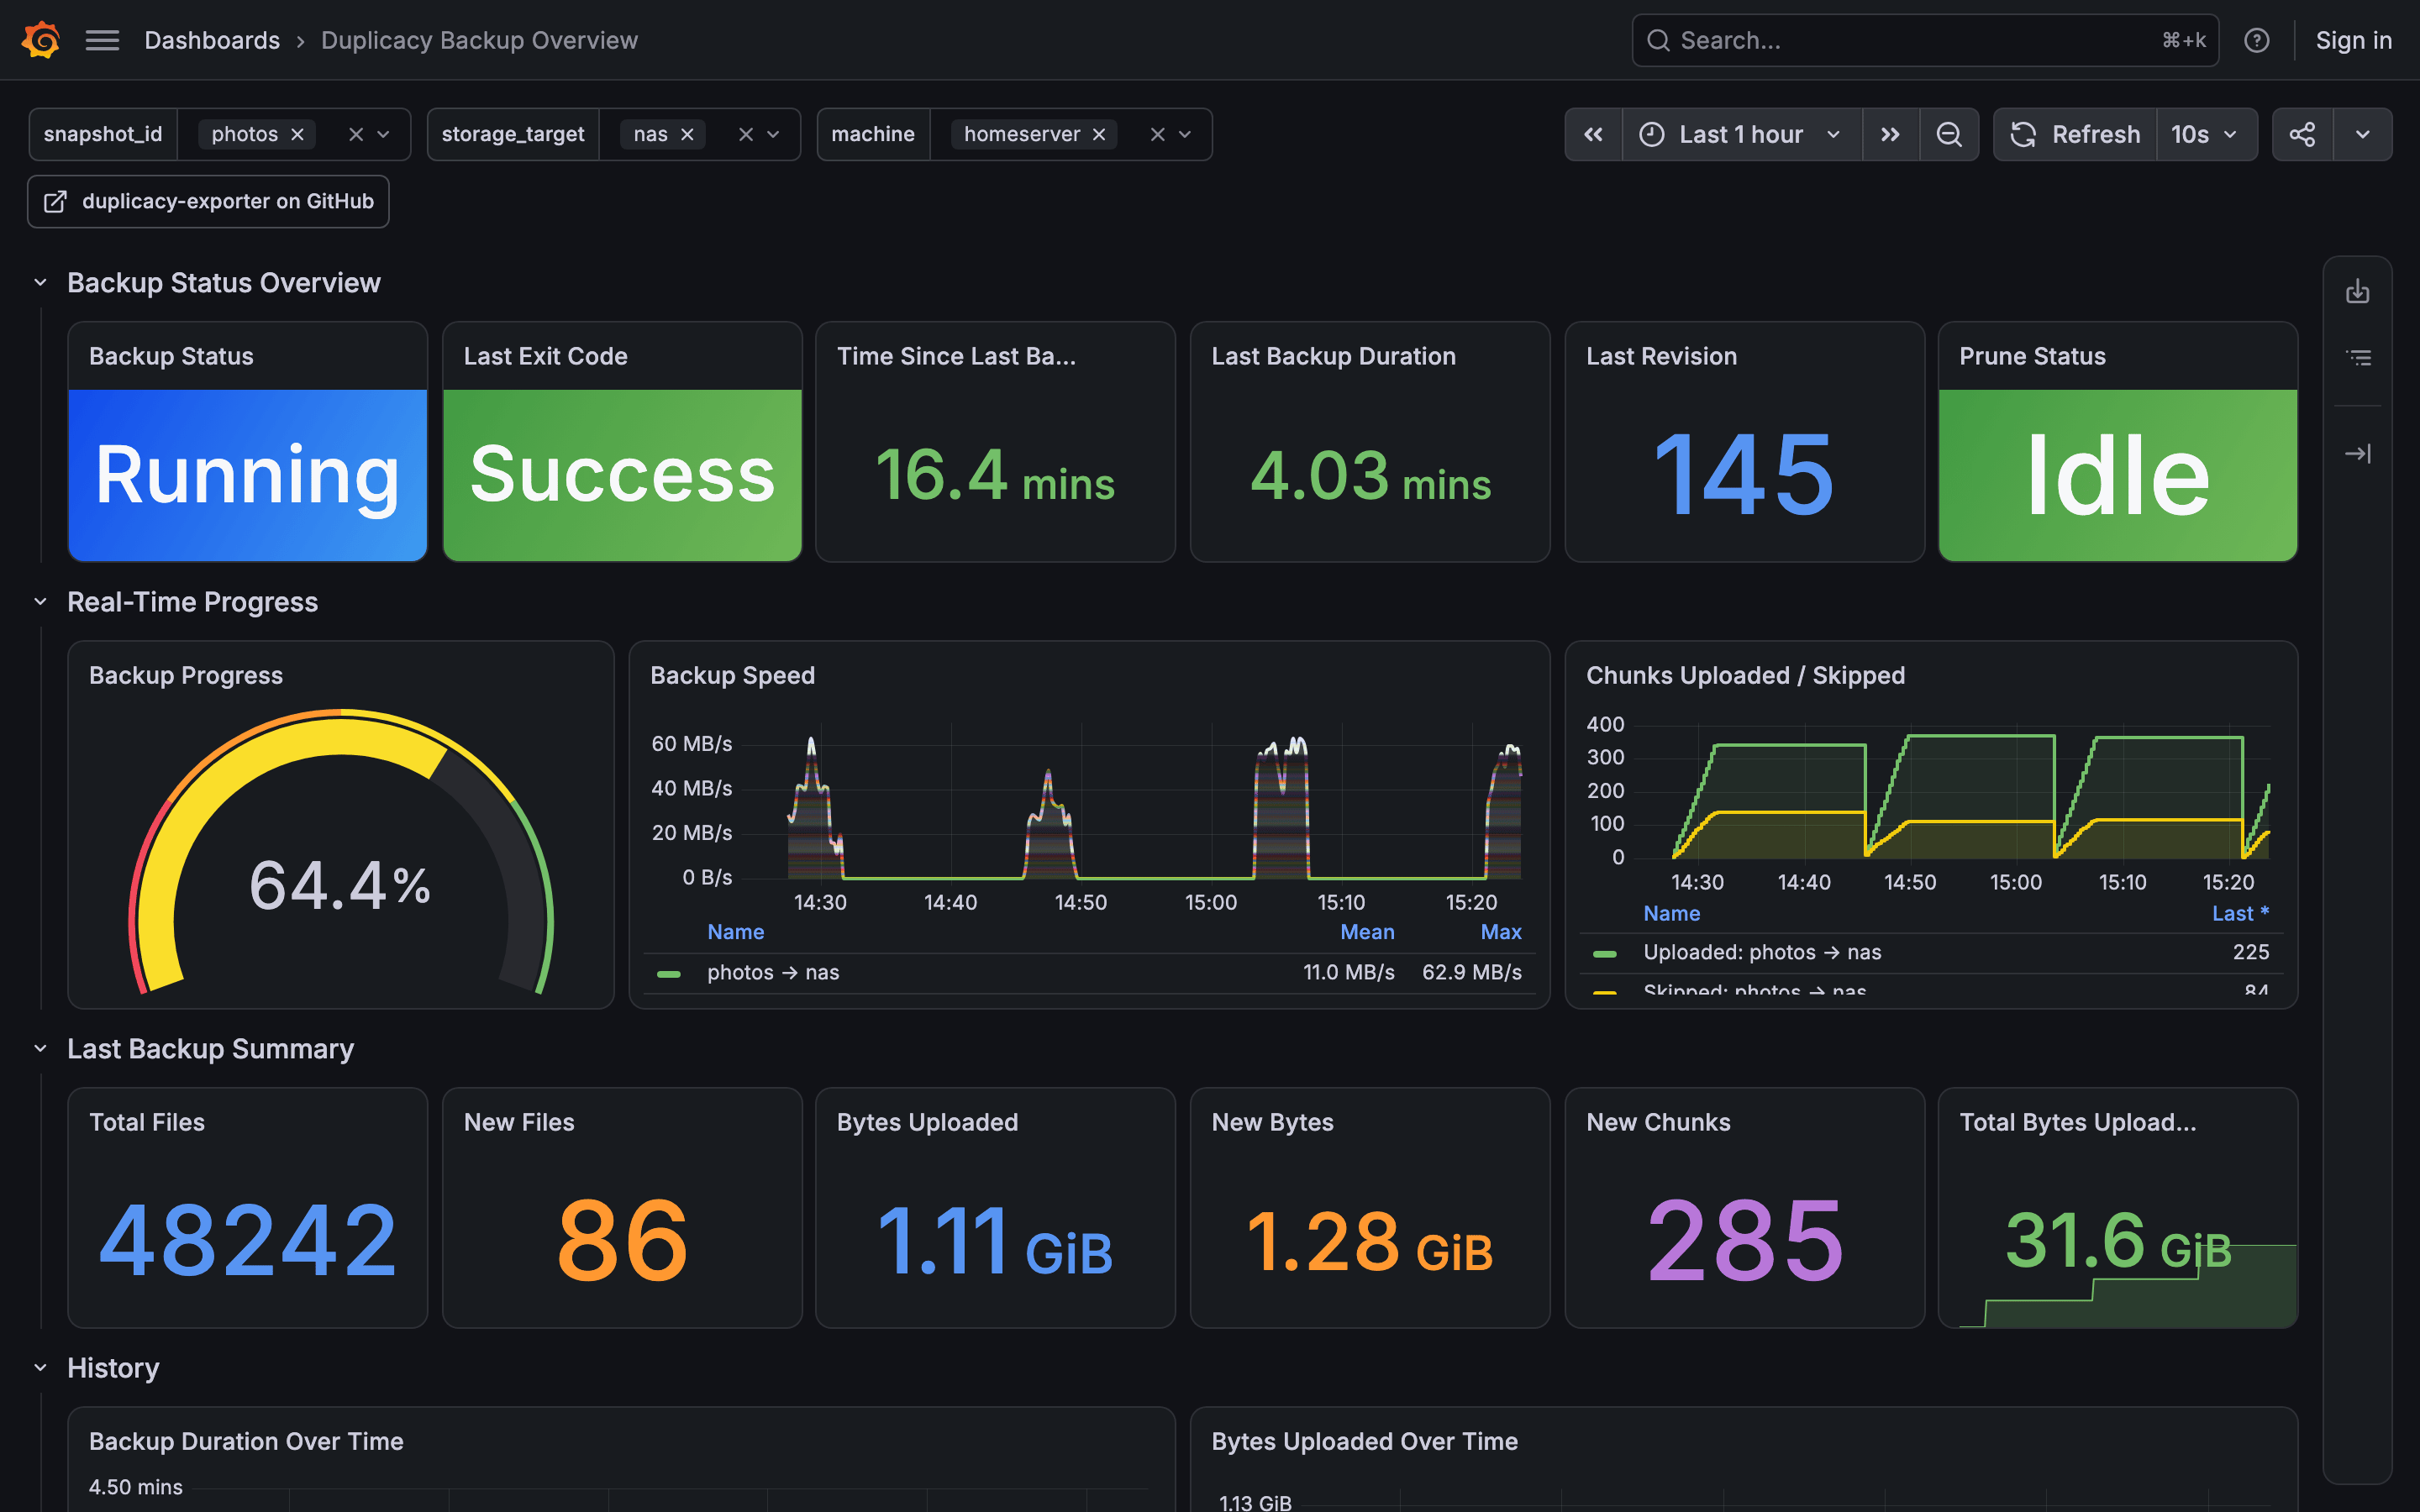
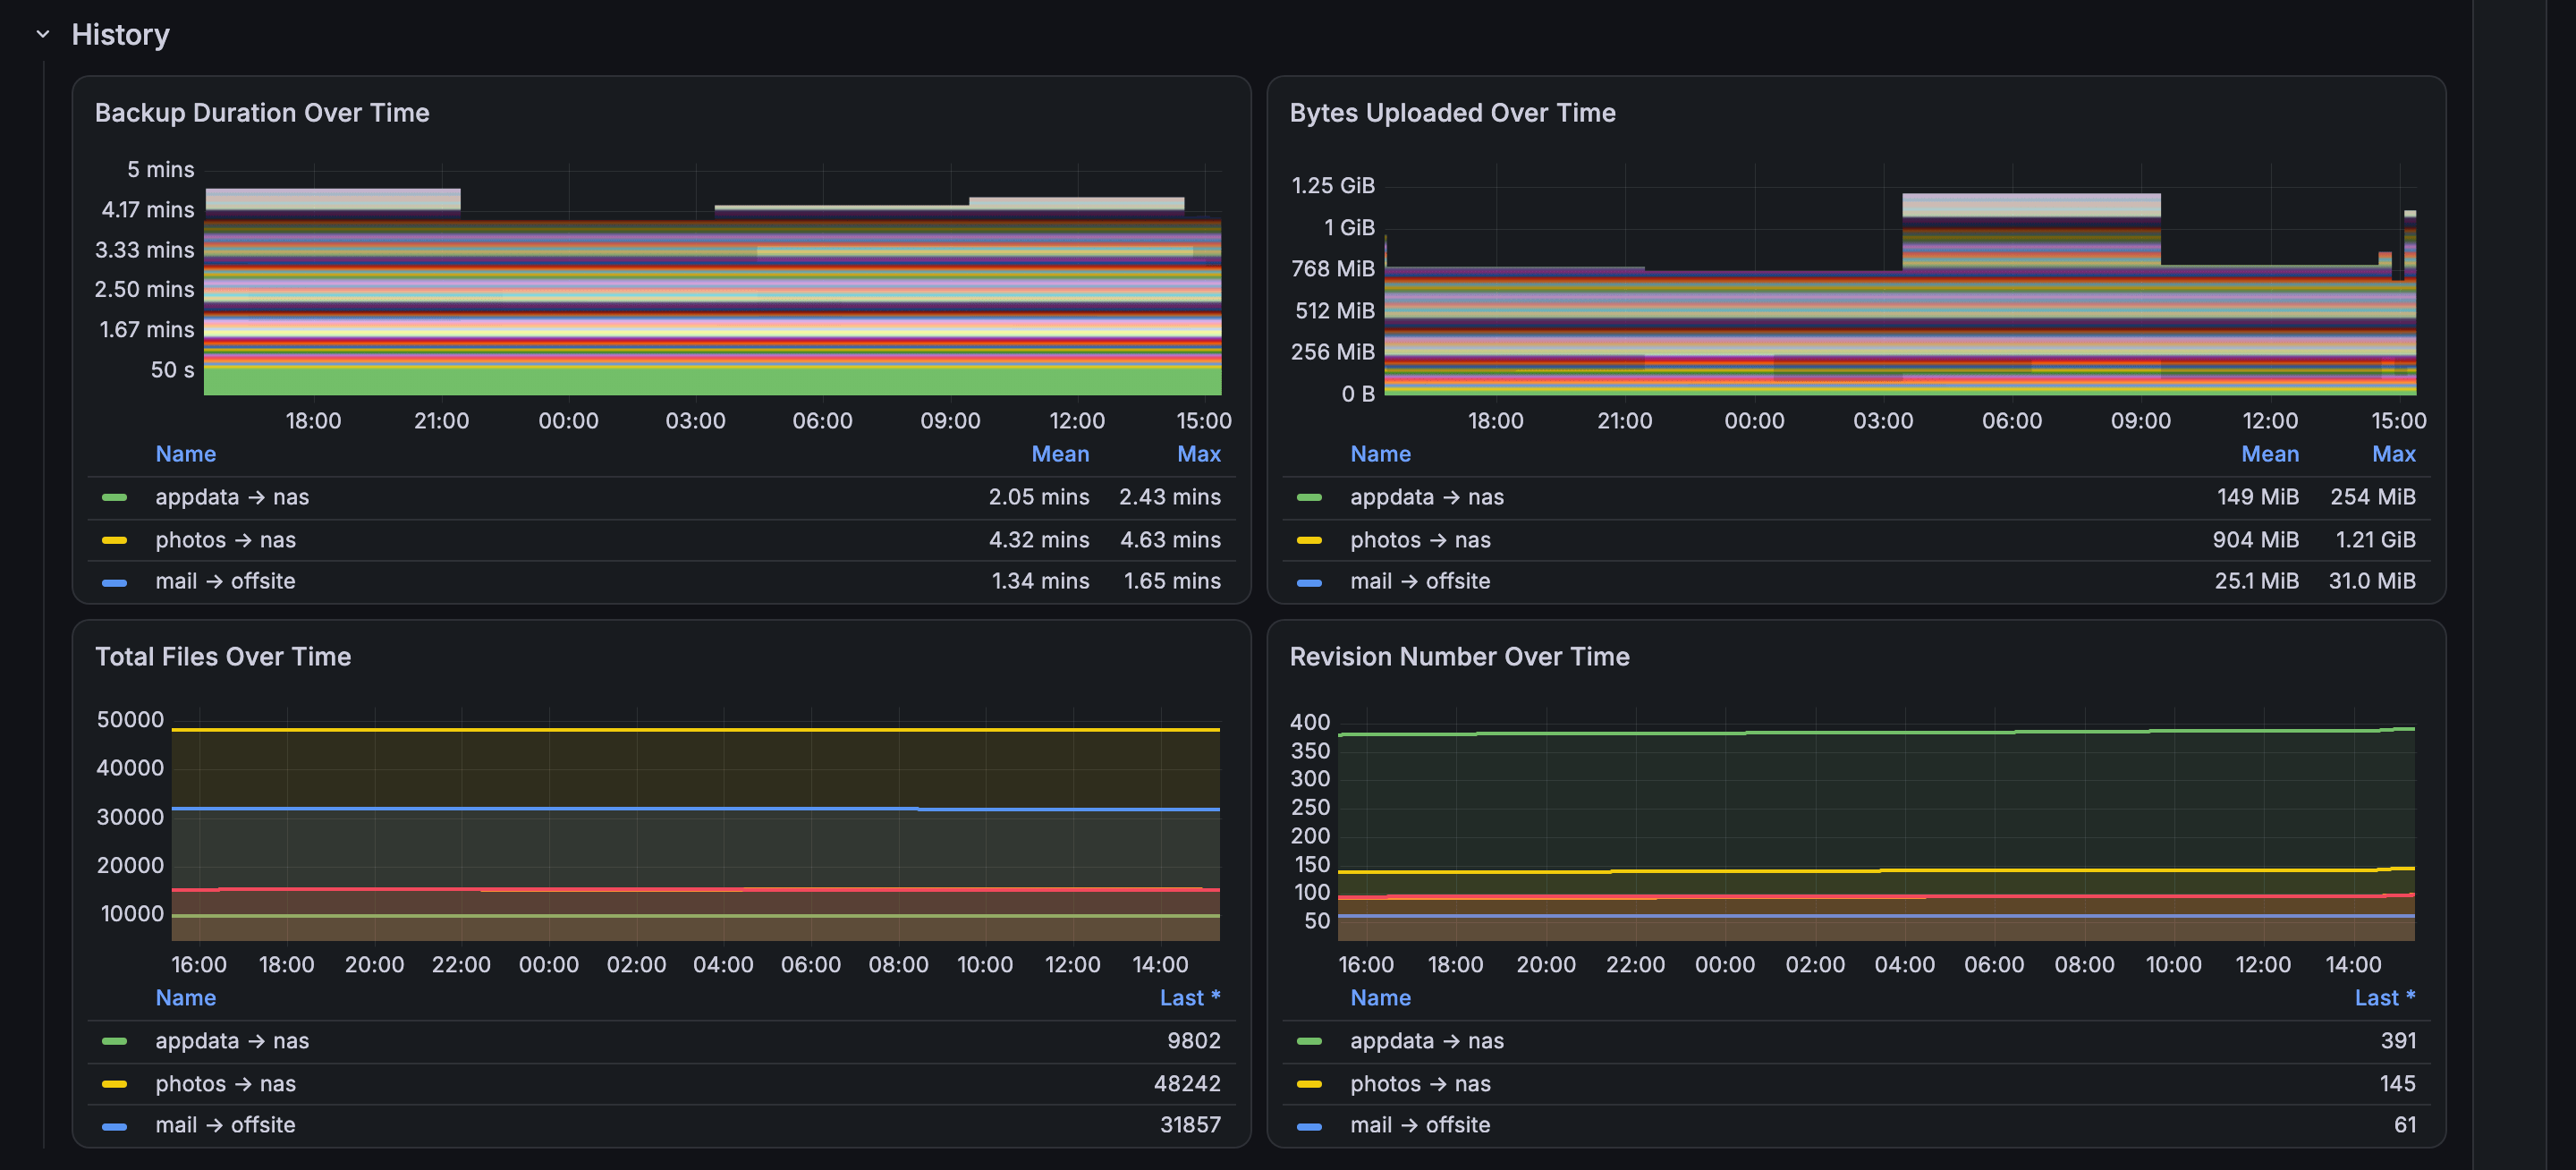
Dashboard 25089 ships with the exporter. The top row is the state of each backup; the second row moves while one runs; the third is the last completed run; the fourth is the history. Filter by snapshot, storage target and machine.
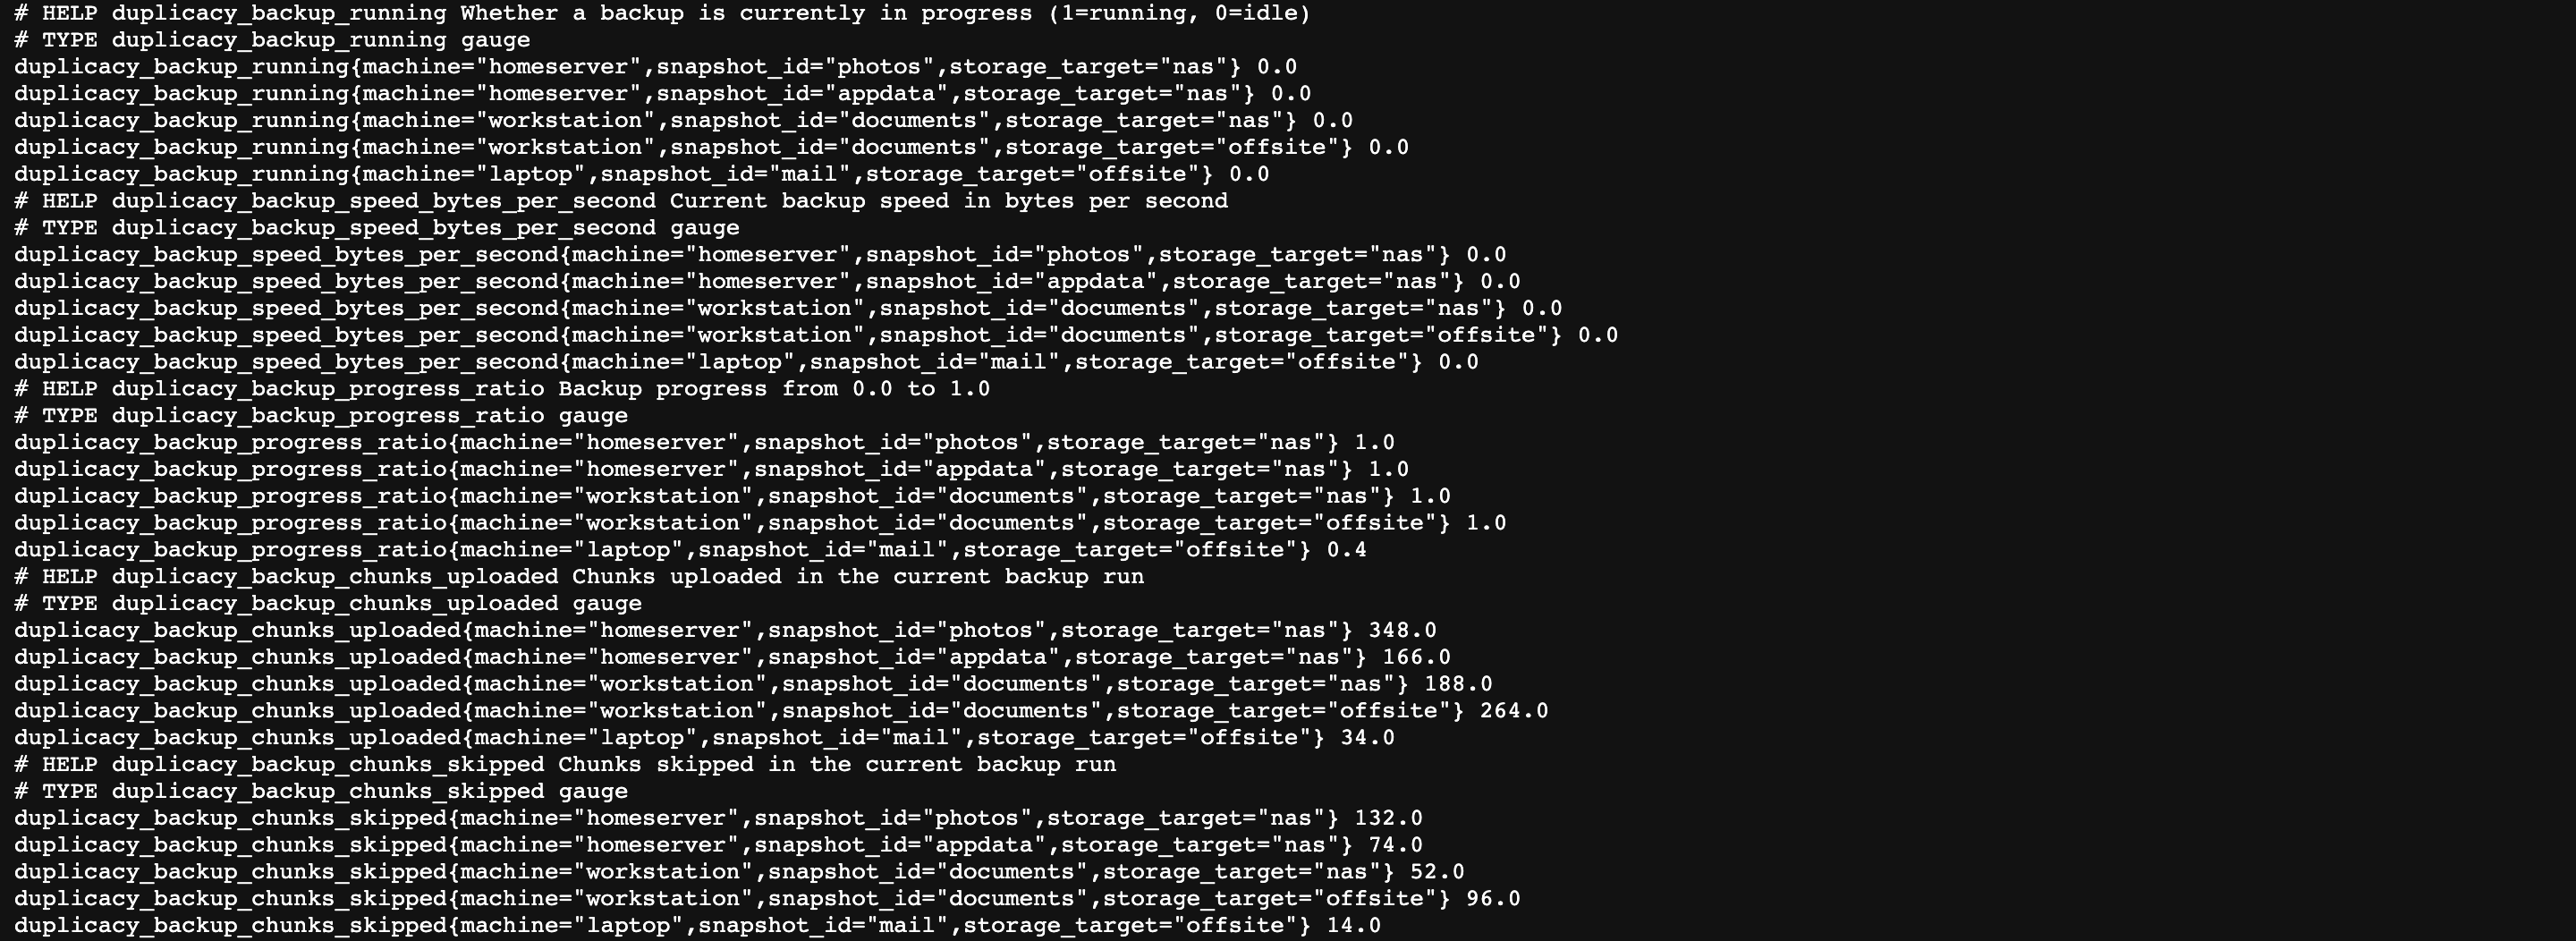
The raw series behind it are on /metrics:
Which mode to use
| You run | Set | You get |
|---|---|---|
Duplicacy CLI with duplicacy-cli-cron, or any log with --- Backup -> Primary (<id>) --- headers |
MODE=log_tail with LOG_FILE or DOCKER_CONTAINER_NAME |
Live progress, speed and chunk counts, the post-run summary, prune timestamps |
Duplicacy CLI with a plain duplicacy backup log |
MODE=log_tail plus SNAPSHOT_ID and MACHINE_NAME |
The post-run summary only; no moving gauge, because a plain log has no header that opens a run |
| Duplicacy Web UI | MODE=webhook and report_url pointed at the exporter |
The post-run summary; no live values, because the Web UI reports only when a backup ends |
Storage size and revision counts are not in any log or report; the storage poller gets them by running the bundled duplicacy CLI, and it is off by default.
How it runs
flowchart LR
    CLI[Duplicacy CLI<br/>log file or container logs]
    WEB[Duplicacy Web UI<br/>report_url]
    EXP[duplicacy-exporter<br/>port 9750]
    STATE[(state.json<br/>last completed values)]
    STORE[(Backup storage)]
    PROM[Prometheus]
    GRAF[Grafana dashboard]
    ALERT[Alertmanager]
    HA[Home Assistant<br/>duplicacy-ha]

    CLI -->|log_tail| EXP
    WEB -->|webhook POST| EXP
    EXP --> STATE
    EXP -.->|optional poller<br/>duplicacy list, check| STORE
    PROM -->|scrape /metrics| EXP
    HA -->|read /metrics| EXP
    PROM --> GRAF
PROM --> ALERT- One container,
drumsergio/duplicacy-exporter, for amd64 and arm64, or theduplicacy-exporterpackage from PyPI. One Python file, one dependency. - In
log_tailmode it parses each line as Duplicacy prints it. Inwebhookmode it parses the JSON report the Web UI posts when a backup ends. See How it works. - The last completed values are saved to
STATE_FILEand served again after a restart, so a dashboard or a Home Assistant sensor never goes blank on an upgrade. See Persistence across restarts. - Every setting is an environment variable. See Configuration.
What it does not do
- It does not run backups, and it never writes to your storage. The optional poller only reads it (
duplicacy listandduplicacy check). - It does not show live progress for the Web UI, or for a plain CLI log without section headers. See Which mode to use.
- It does not record prune runs from the Web UI, and no mode reports storage size without the poller.
- It has no web page of its own beyond
/metricsand/health; Grafana is the screen.
Privacy
- The exporter reads a log file, a container's logs, or a POST from your Web UI. It makes no outbound request unless the poller is on, and then only to your own storage with credentials you mount.
- Storage URLs are reduced to a host label.
STORAGE_HOST_MAPandTAILSCALE_DOMAINturn addresses into names you choose, so an IP or a tailnet name need not appear in a dashboard. - Metrics carry three labels:
snapshot_id,storage_target,machine. File names never leave the log.
Getting help
- If something is broken, read Troubleshooting, then open an issue with the exporter's log at
LOG_LEVEL=DEBUG. - To report a security problem, follow the security policy and do not open a public issue.
- The releases page lists what changed between versions.
- The rest of the Duplicacy family (container image, cron wrapper, Home Assistant integration, MCP server) is on Related projects.
- To send a fix, read Development.
License
duplicacy-exporter is released under the GPL-3.0-or-later license. It is built on prometheus_client.